We provide infographics to increase the range of content on a website and for the benefit of increasing visibility and rankings on Google, Yahoo and Bing.
Infographics have been around for a while, mainly used in newspapers in the late 1990s but in the late 2000s have made their way online. They were a bit of a fad at the time, but now due to the change in the Google algorithm with the Penguin and Panda updates, there is much more focus on quality content as opposed to chasing after high quality links.
Infographics is one technique that we use with our clients to improve the quality and range of content available on a website, and in turn use in our outreach strategies to increase inbound links.

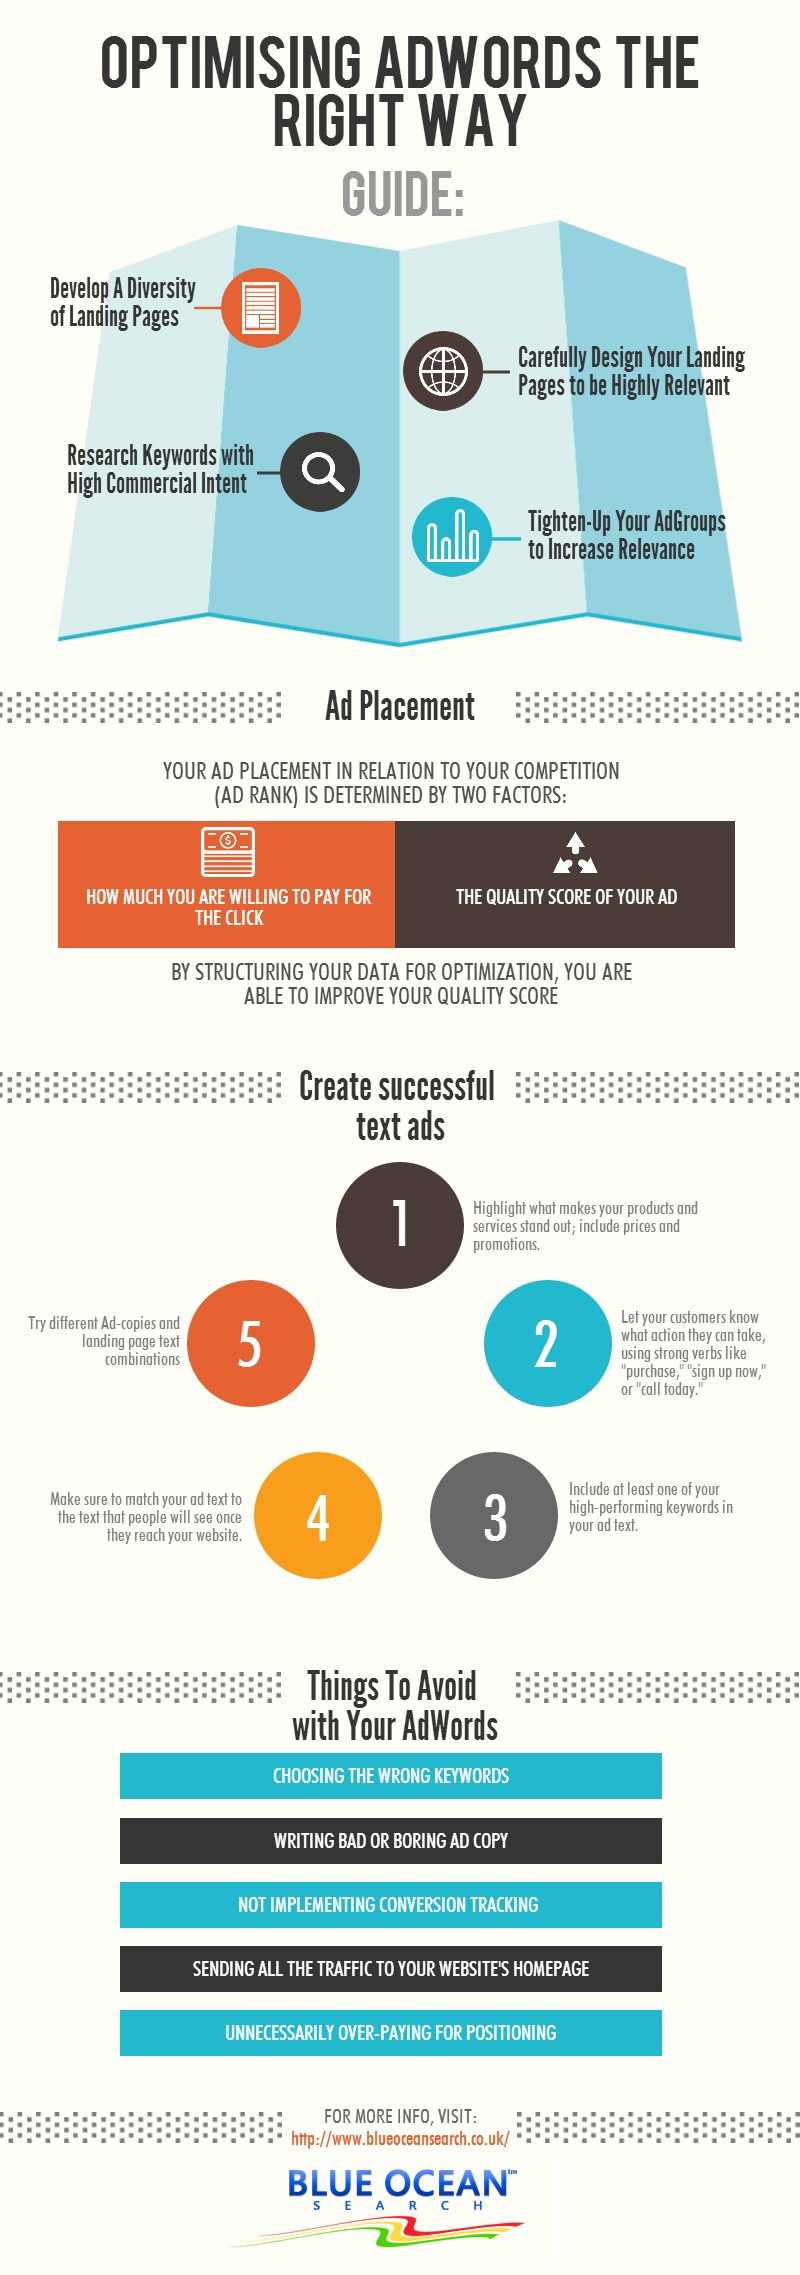
What Are Infographics?
Infographics are a pictorial representation of data, text and/or content. They were originally used to display large amounts of data in a more digestible format than text. Due to their eye catching designers, they engage with consumers better than text content, particularly if the data is heavily reliant upon statistics.
Infographics can be used for product or service videos, in your blog, company history details or anything that you feel could be explained using pictures.
What Are The Benefits?
- We find the main benefit of infographics is higher engagement. Consumers prefer to spend time looking at images like infographics rather than wading through reams of text content.
- As a result, infographics encourage higher time on site, lower bounce rate and more pages per visit.
- Infographics are also hugely shared, which means that we can reach a wider audience, encourage more people to visit the website and in turn attract more natural links to the website.
- If people find the content of infographics, or a website in general, to be useful and interesting, then this will increase shares and citation/links.


What Is The Process Of Getting An Infographic Made With Blue Ocean Search?
If you are interested in how we can help you
Create your perfect infographic, or how we can help with your overall SEO strategy then feel free to get in touch today.
Contact Us